In today’s data-driven world, organizations are leveraging powerful analytics tools like Tableau to make informed workforce decisions. HR teams can transform raw data into actionable insights, helping them enhance employee experience, optimize hiring processes, and improve overall workforce productivity.
One of the most effective ways to achieve this is by creating an HR Dashboard—a comprehensive visualization tool that provides real-time workforce analytics. In this blog, we will explore how Tableau enables HR professionals to derive meaningful insights from their data.
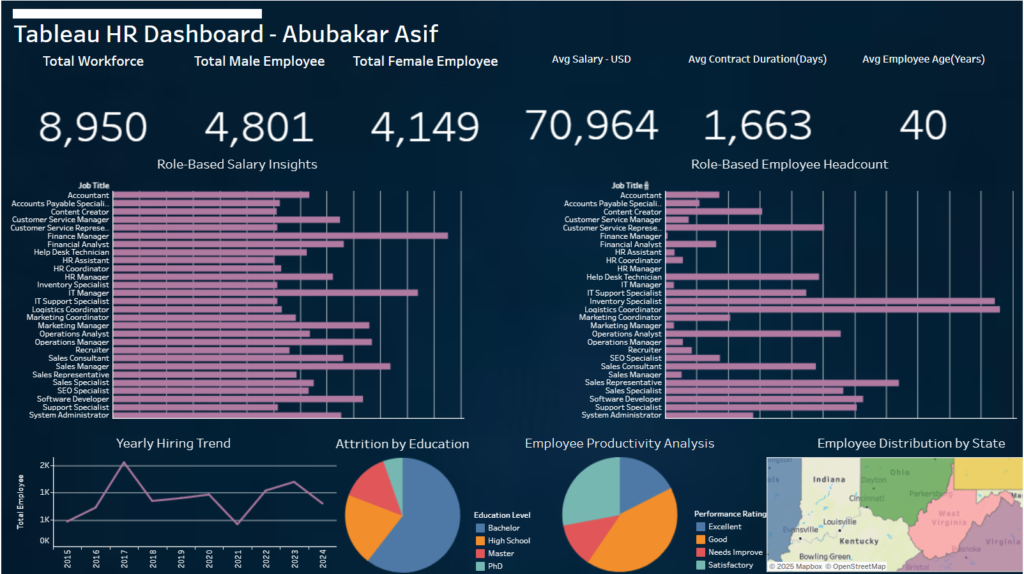
Key Features of an HR Dashboard
1. Role-Based Salary Insights
Understanding salary trends across various job roles is crucial for maintaining competitive compensation structures. Tableau enables HR teams to:
- Compare salary distributions by department, experience level, and location.
- Identify pay disparities and ensure fair compensation.
- Track salary trends over time for better financial planning.
2. Employee Headcount Analysis
Keeping track of workforce distribution is essential for resource allocation and planning. With Tableau, you can:
- Visualize headcount distribution by job title, department, or location.
- Identify talent shortages and surpluses in different teams.
- Make strategic hiring and workforce planning decisions.
3. Productivity and Attrition Metrics
Retaining top talent and improving employee engagement is a priority for any organization. The HR Dashboard helps in:
- Monitoring employee performance and productivity trends.
- Identifying departments with high turnover rates.
- Recognizing patterns in employee exits and taking proactive measures.
4. Geographic Workforce Distribution
For businesses with multiple offices or remote teams, understanding where employees are based is crucial. Tableau allows HR teams to:
- Map out workforce distribution across different states or regions.
- Identify hiring trends in specific locations.
- Optimize remote work strategies based on workforce distribution data.
5. Yearly Hiring Trends
Historical hiring data provides valuable insights into recruitment patterns and helps HR teams optimize their strategies. With Tableau, you can:
- Analyze hiring trends over the years.
- Identify peak hiring seasons and budget accordingly.
- Measure recruitment effectiveness and adjust hiring plans accordingly.
Why Use Tableau for HR Analytics?
Tableau is a powerful data visualization tool that enables HR professionals to:
- Simplify Complex Data: Convert raw HR data into visually appealing and easy-to-understand charts and graphs.
- Make Data-Driven Decisions: Move beyond gut feelings and base HR strategies on factual insights.
- Enhance Workforce Planning: Forecast hiring needs, track employee performance, and optimize retention efforts.
- Improve Employee Experience: Identify pain points and create data-backed policies to enhance employee satisfaction.
Final Thoughts
A well-designed HR Dashboard in Tableau can transform the way organizations manage their workforce. By providing clear insights into salary trends, employee distribution, productivity metrics, and attrition rates, HR professionals can make smarter, data-driven decisions.